| PAT 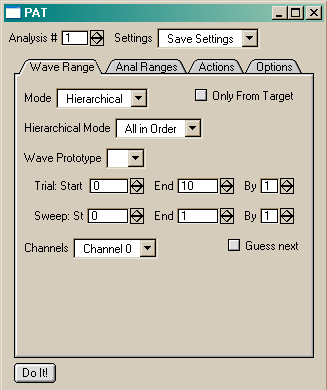
|
The basic idea of this tool is that it performs various actions on multiple waves. You can pick which waves the tool will run through and have one or more actions performed on each wave. The strength of the tool is the ease and flexibility of picking multiple waves, and that multiple actions can be performed simultaneously. The strongest version of this is for waves named hierarchically, like the output from electrophysiology software from HEKA and Axon. But you can also do various types of pattern matching or even call your own function to pick the names. There are several built-in actions and it is easy to add more. The actions include things like averaging and duplicating waves (“Processing”) and making numerical measurements from portions of the waves that you specify (“Analysis”). It is designed for analysis of electrophysiological experiments but can do many things useful for any Igor user. Analysis result waves are graphed automatically and a fairly complete record of what was done is saved in the History. Appears on Macro menu. |
Manual (pdf)
Igor procedure file (you must remove the .txt extension)
Associated Igor procedure file for loading Axon Binary Files(you must remove the .txt extension)
|
| Log Cursor Info 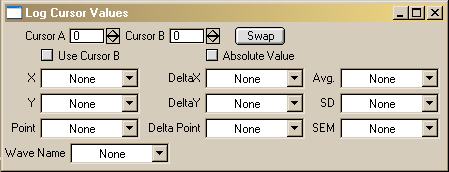
|
This is a utility to make it easy to transfer (“log”) repeated measurements made with the cursors to waves of your choice. It makes a panel which lets you choose or create the waves to log the data to. It will log X, Y, Point, and Wave Name from one cursor, and deltaX, deltaY, deltaPoint, average, SD, and SEM from two cursors. Appears on Analysis menu. |
Manual (pdf)
Igor procedure file (you must remove the .txt extension)
|
| Image Analysis 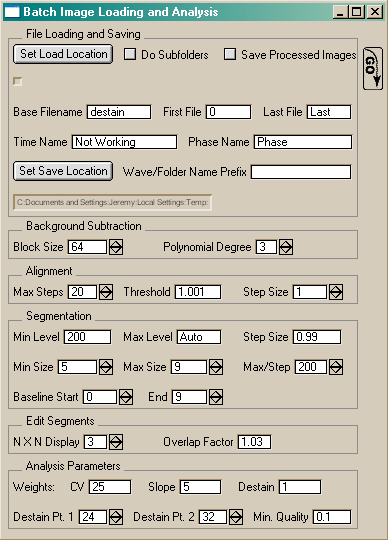
|
Designed for analyzing FM dye destaining experiments.
This makes a panel with various options which allow you to point at any number of experiments, each of which contains {a set of fluorescence images taken at different times, a phase-contrast image of the same field of neurons, and a file indicating the timing of the fluorescence images}. The background is subtracted, the images are aligned to each other, the sites of transmitter release are found by an algorithm that searches for local fluorescence maxima according to size and intensity spatial derivative, the destaining of each of the sites is determined against time, this destaining is scored according to several user-weighted factors for "quality", and the destainings exceeding a certain quality threshold are averaged. All of this is done without user intervention except for the ability to manually remove spuriously found release sites. Loads data collected with IPLab, Wasabi, or basic TIFF files.
Includes a set of routines to make a movie out of a series of images with a fixed overlay layer (in other words, you might watch the destaining annotated with a release site map).
Also includes some routines to make loading the above image file types easier, including the ability to load all the image files in a folder in one go.
Appears in the Macro menu. |
Manual (pdf)
Igor procedure file (you must remove the .txt extension)
|
| Categorize and Staticize 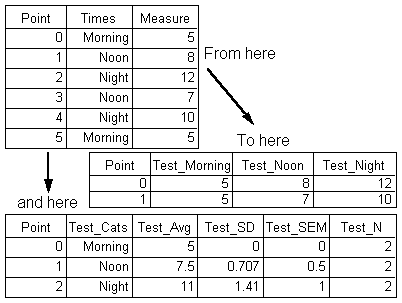
|
This function lets you choose one data wave and one text wave which has entries for which category the entries in the data wave belong to. It makes new waves for each category it finds and puts the right entries in them. It also makes a wave with the categories in it, and waves with the average, SD, SEM, and N for each category. Does not appear on a menu. |
Description (text)
Igor function (must paste into procedure file)
|
| Paste Transpose |
The only thing better about Excel than Igor is the way you can move data around on the spreadsheet. One handy feature in Excel is Paste Transpose, which pastes data with the rows and columns reversed. This copies selected data on a table to new waves with the data transposed. Does not appear on a menu. |
Igor function (must paste into procedure file)
|
| Misc. Markup AddLabels:
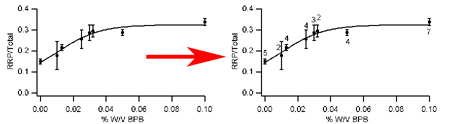 |
Four small cosmetic functions: SquarePixels Adjusts the aspect ratio of the top image plot according to the current axis ranges so that the pixels are square. Appears in the Graph menu. NoAxesEtc Removes axes, ticks, and labels from the top graph. Electrophysiologists love these graphs. Appears in the Graph menu. AddLabels Perhaps confusingly named, adds a tag to every point of a selectable trace from the top graph, where the tag text comes from text or numeric wave. I use it to add tags containing N values to plotted data points where I have an N wave. A field with the flags to the tag command is supplied if you would like to control the default tag appearance. Can also kill tags previously added with this procedure. Appears in the Graph menu. NoFramesEtcGets rid of frames and makes background transparent for all graphs on the top layout. Appears in the Layout menu. |
Igor procedure file (you must remove the .txt extension)
|
| Load Binary by Pattern 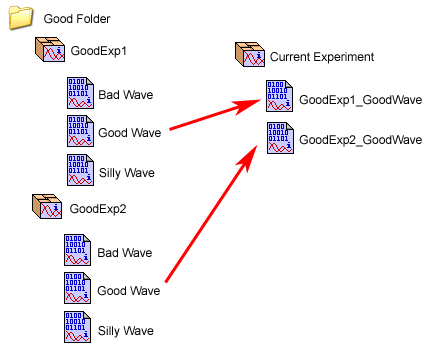
|
Loads waves from packed Igor experiments. You can use wildcards for the experiment name, datafolder name, and wave name and automatically load lots of waves at once. Loaded waves are named FileName_DataFolderName_WaveName and are loaded into the current data folder. Note that if you use a wildcard for the data folder then the whole experiment is loaded in temporarily so it can take a while for large experiments. Appears in the Data menu. |
Igor procedure file (you must remove the .txt extension)
|
| 2D Decimate |
Igor has a built-in decimate for 1D waves, this works on an X-Y pair. It temporarily sorts the waves and bins the data as best it can, averaging X and Y values. |
Igor function (must paste into procedure file)
|